The Historic Underestimation of Renewable Generation

Colin Palmer
40 years: Renewable energy
In this video, Colin explains how the International Energy Agency's predictions for renewable energy have changed in the last 20 years. He also explains the S curve model of technical change and finishes by highlighting the space requirements for renewable energies.
In this video, Colin explains how the International Energy Agency's predictions for renewable energy have changed in the last 20 years. He also explains the S curve model of technical change and finishes by highlighting the space requirements for renewable energies.

The Historic Underestimation of Renewable Generation
9 mins 47 secs
Key learning objectives:
Explain the extent to which predictions and reality have differed for the deployment of renewable energy
Contrast linear and exponential models of technical change
Explain when renewable energy will be cost competitive with other forms of electricity generation
Describe the space requirements for renewable energies
Overview:
In the year 2000 the UK set a target to secure 20% of electricity from renewable sources by 2020. This was met with widespread scepticism at the time. Yet the actual figure in 2020 was 43%, with 24% coming from wind energy alone. At a global level, in 2002 the IEA predicted that the total installed PV capacity in 2020 would be 20GW. In fact, the capacity was 713GW, with 126GW added in 2020 alone. Similarly woefully incorrect predictions were made about the future cost of renewable energy, the rise of electric transport and the stability of electrical systems when large proportions of renewable generation are connected. How did these experts get things so wrong? It appears that a great many predictions are implicitly (but seldom explicitly) based on more or less linear rates of change, whereas most technological change is exponential. Once a technology gains a foothold, it’s market penetration becomes exponential, changing so fast it is generally only understood with hindsight. In the modern world, the rates of penetration are becoming faster and faster. As volume rapidly scales, costs decrease, resulting in a virtuous feedback loop, further accelerating the rates of change. Wind energy, and solar PV in particular, are but a very recent manifestations of this trend.
How has The International Energy Agency predictions for renewable energy changed in the last 20 years?
The International Energy Agency is one of the most respected voices in energy. Each year it produces a report that makes predictions of future energy demand and the mix of energy generation. In the early years of the 21st century, it predicted that global solar PV capacity would be 20GW in 2020. By 2010 it had raised this figure to 120GW. It was not until the 2020 report that it finally accepted the exponential rise of solar (and wind) energy, predicting 43% more solar output than in the 2018 report, due to costs being 20% to 50% less than thought. It even declared that solar power can offer the “cheapest electricity in history”.
What is the S curve model of technical change?
The “S” curve describes the characteristic shape of the market penetration pattern of new technologies. It has been documented time and again and the main difference between now and, say, the days of the model T Ford is that the process has become more rapid. When a new technology or invention first reaches the market, it tends to be expensive, feature poor and unreliable. This limits the initial uptake, and may result in complete failure. If this does not happen, increasing sales enable manufacturers to improve the design and reduce costs, increasing the appeal of the product. At some point, this feedback loop of increasing volume, increasing performance and reducing costs takes the product into the mass market and sales increase exponentially. Eventually, the market becomes saturated, and sales tail off, resulting a “S” shaped trajectory. This process has been repeated time and again and is accelerating. It took nearly 50 years for electricity to fully penetrate the US market, 30 years from colour TVs, and just 15 years for the cellphone.
When will renewable energy be cost competitive with fossil fuel sources?
In many locations this is already the case and as cost reductions continue, this advantage will be become increasingly wide spread. According to the Lazard 2020 Cost of Energy Analysis, large scale solar PV and onshore wind are lower cost than than new combined cycle gas turbines (the lowest cost source of fossil fuelled electricity) and comparable with the marginal of gas generation. The cost of new nuclear generation is around four times that of onshore wind and more than twice that of offshore wind.
Does the world have sufficient land area for renewable energy?
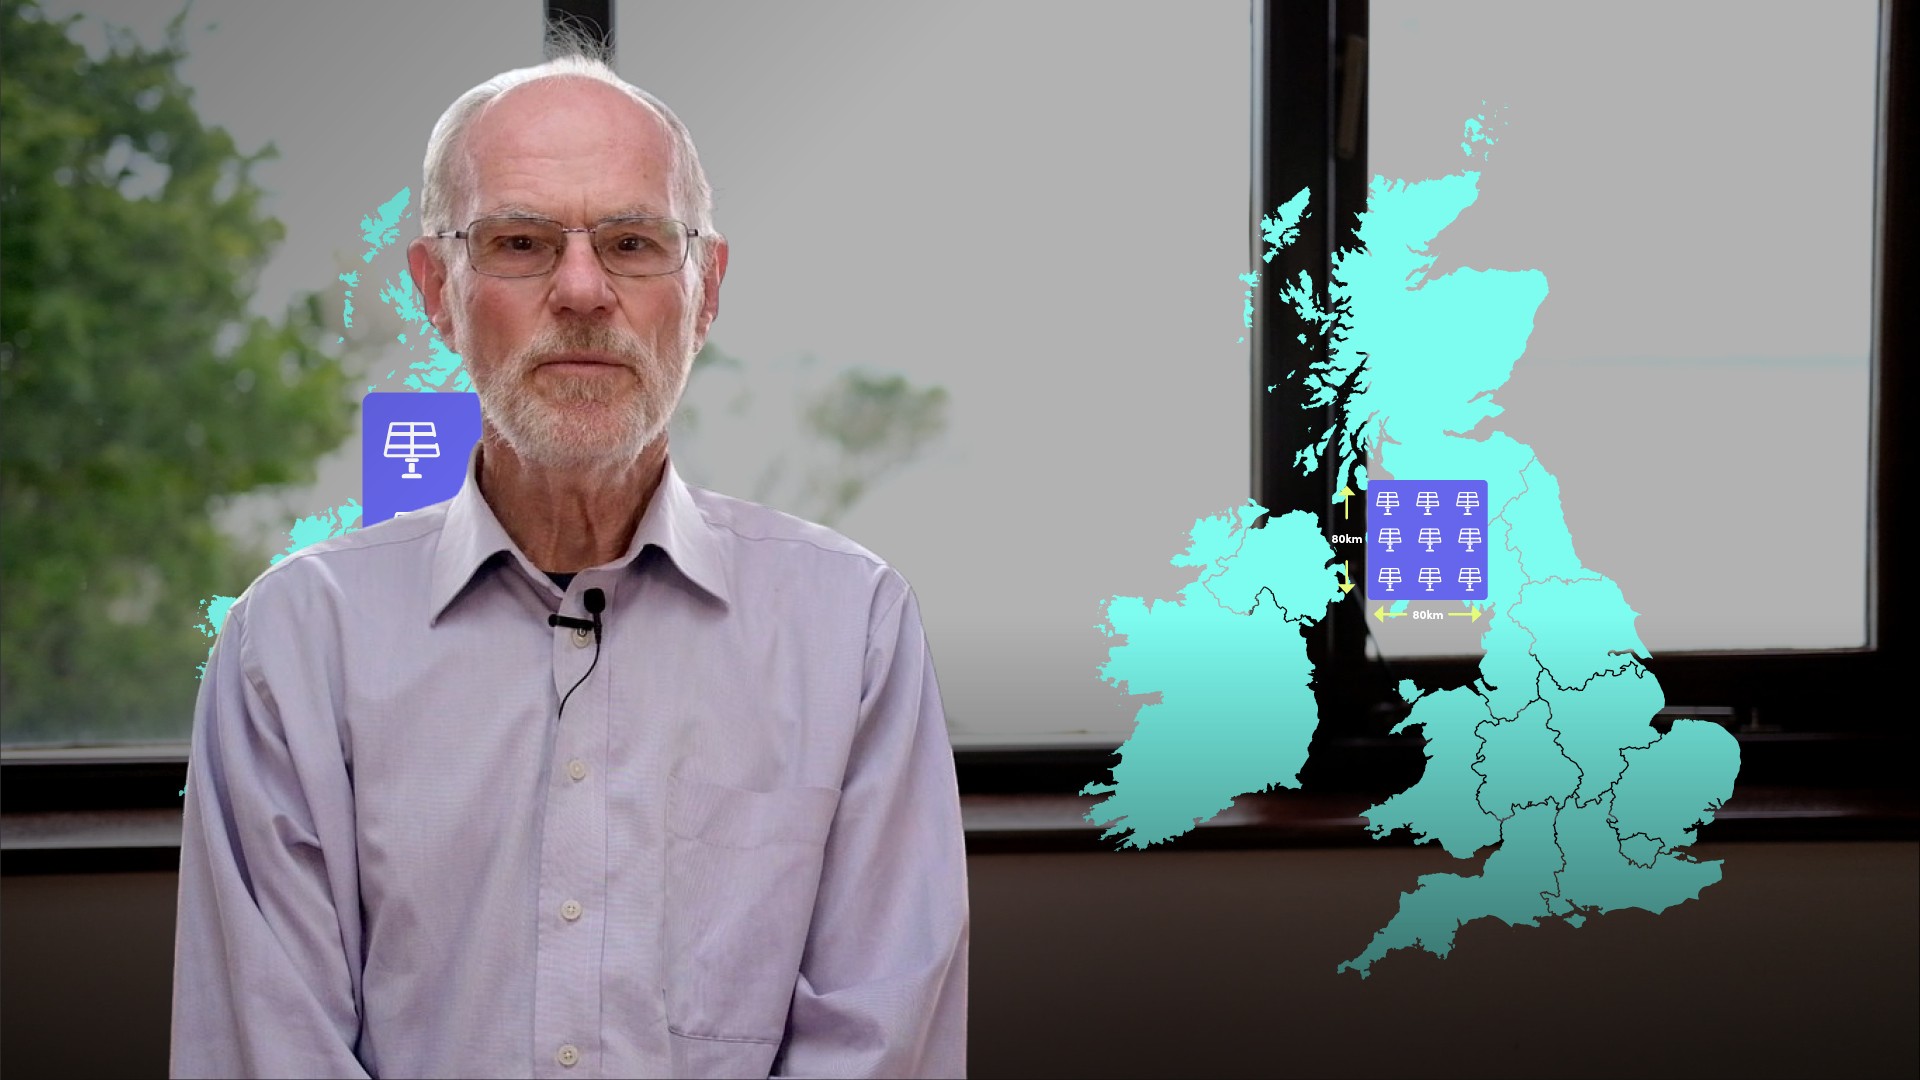
Renewable energy is fundamentally a low density source of energy. If the world were to be powered by solar PV, a land area of 600km by 600km, the area of many countries, would be required. This may sound large, but it is only 0.07% of the total land area, so if spread across the globe, the impact would be small. The calculations are similar for wind energy. Renewable energy installations certainly require more land area than traditional power stations, but compared to other land uses, the impact is not excessive.

Colin Palmer
There are no available Videos from "Colin Palmer"


